

Monitor setup
Create a monitor
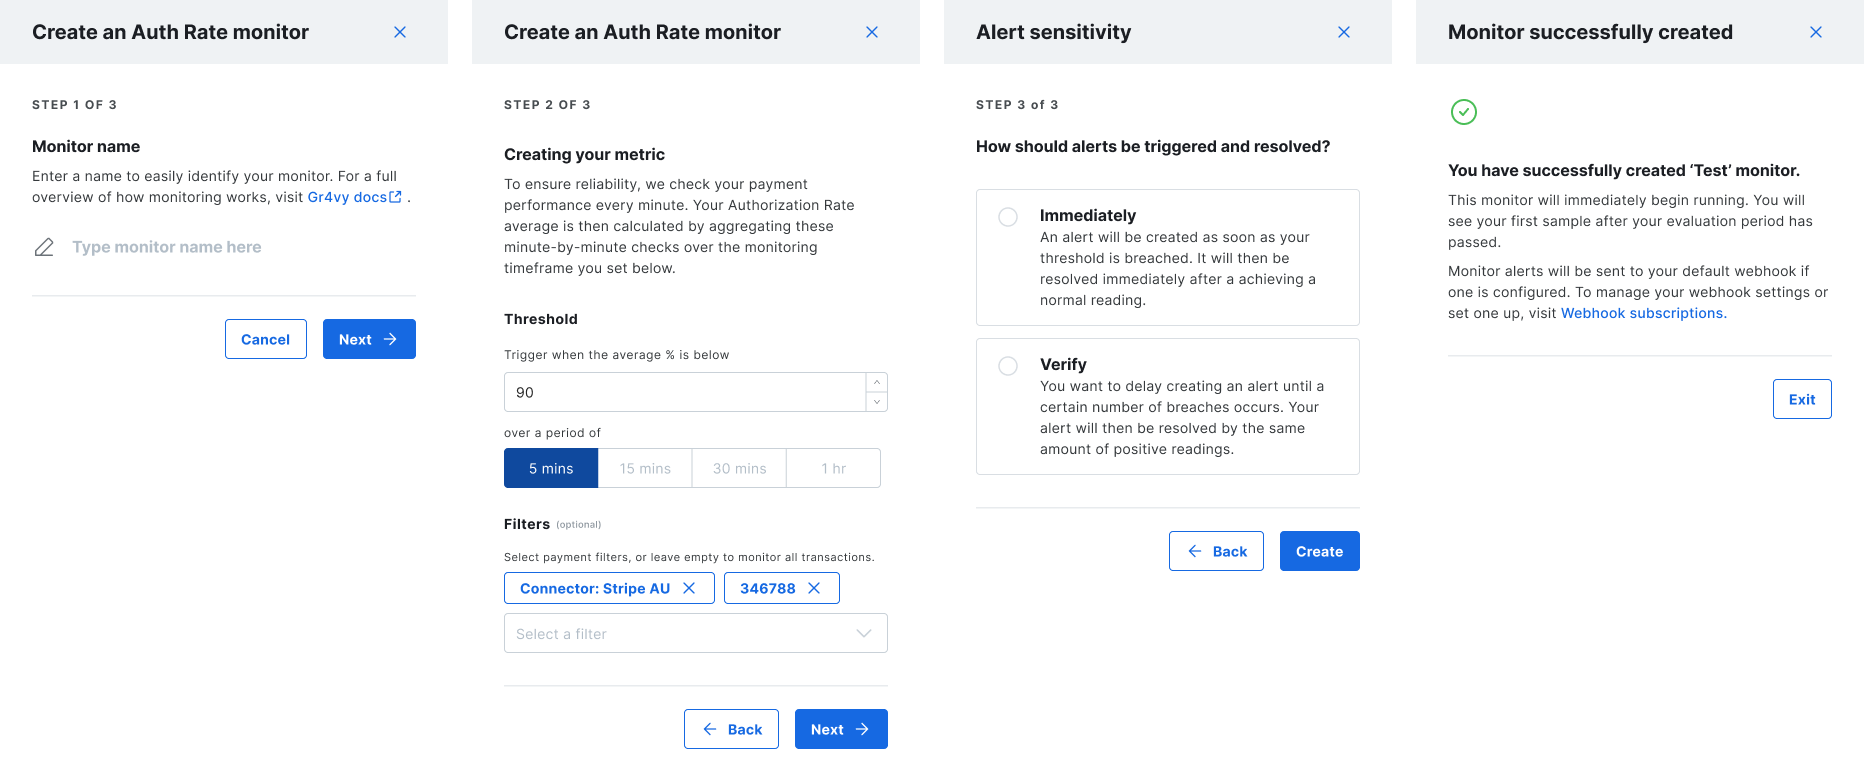
The wizard guides you through three steps: naming the monitor, defining the metric and threshold, and configuring alert behavior.1. Name your monitor
Provide a clear, descriptive monitor name so it is easy to identify in the dashboard. Good names typically reference a specific connector, region, or traffic segment. Select Next to continue.2. Define the metric
Configure how the authorization rate should be evaluated.- Threshold - The minimum average authorization rate considered healthy. Must be a whole number between 1 and 100. Defaults to 90%.
- Evaluation period - The time window used to calculate the average: 5 minutes, 15 minutes, 30 minutes, or 1 hour. Defaults to 5 minutes.
- Filters (optional) - Restrict which transactions are included in the calculation, such as by payment method, connector, or BIN.
Each monitor must have a unique combination of parameters. You cannot create a
monitor with the same threshold, evaluation period, and filters as an existing
monitor to avoid tracking the same metric twice.
3. Configure alert sensitivity
Choose how quickly alerts are triggered and resolved.- Immediately - An alert fires as soon as a single sample breaches the threshold and resolves as soon as the metric returns to a healthy value.
- Verify - Choose the number of consecutive breaching samples required before an alert fires. The alert resolves only after the same number of consecutive healthy samples.
Filters
Monitor metrics use a specification that controls which transactions are included in the calculation.
The evaluation period and filters are immutable after creation to ensure the data definition remains consistent over time. The monitor name, threshold, and alert sensitivity can be updated after creation.
Next steps
Once the wizard completes:- The monitor starts running immediately.
- The first sample is available straight away and covers the evaluation period leading up to the monitor’s creation.
- Alerts are delivered to your default webhook, if one is configured in your dashboard.
- View past alerts at any time in the Alerts log tab—alerts are retained for up to 365 days.