

- Authentication tab
- Authorization tab
Controller

The insights controller
- The first selector lets switching between volume (accumulated transaction value) and transactions (transaction count).
- The currency selector allows filtering for any used currency over 60+ days for the homepage dashboard. The insights dashboard allows selecting a currency used in the selected time period. The currency selector is only available when volume is selected.
- The time selector allows changing the time range for which the data on the dashboard is shown. It’s possible to show the data for last 24 hours, last 7 days, and last 30 days.
Presets
Using presets, selected filters can be saved to view and share. The filters selected can be saved and can be named accordingly. If needed, the preset can be renamed by selecting the preset and selecting Rename Preset via the same menu used to select the preset. Via that menu it is also possible to delete the preset. It is possible to have multiple presets. Each can be saved separately and are listed under the Presets button. Saving presets is possible for users with theAdministrator and Analyst roles.
There is a maximum of 10 presets that can be saved for each of the separate tabs in the insights dashboard.
Presets are only available in the Insights dashboard, and not on the dashboard
homepage.
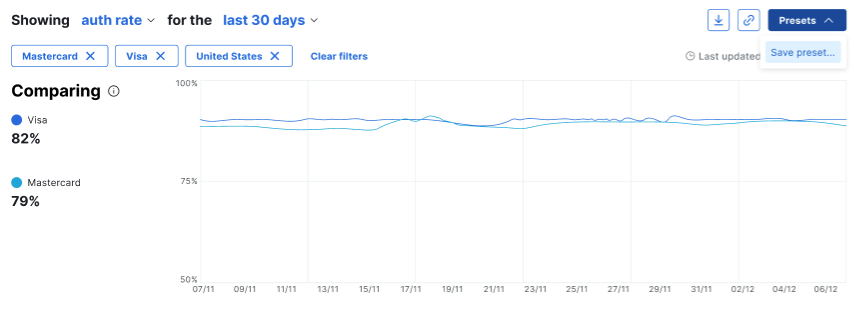
Line chart
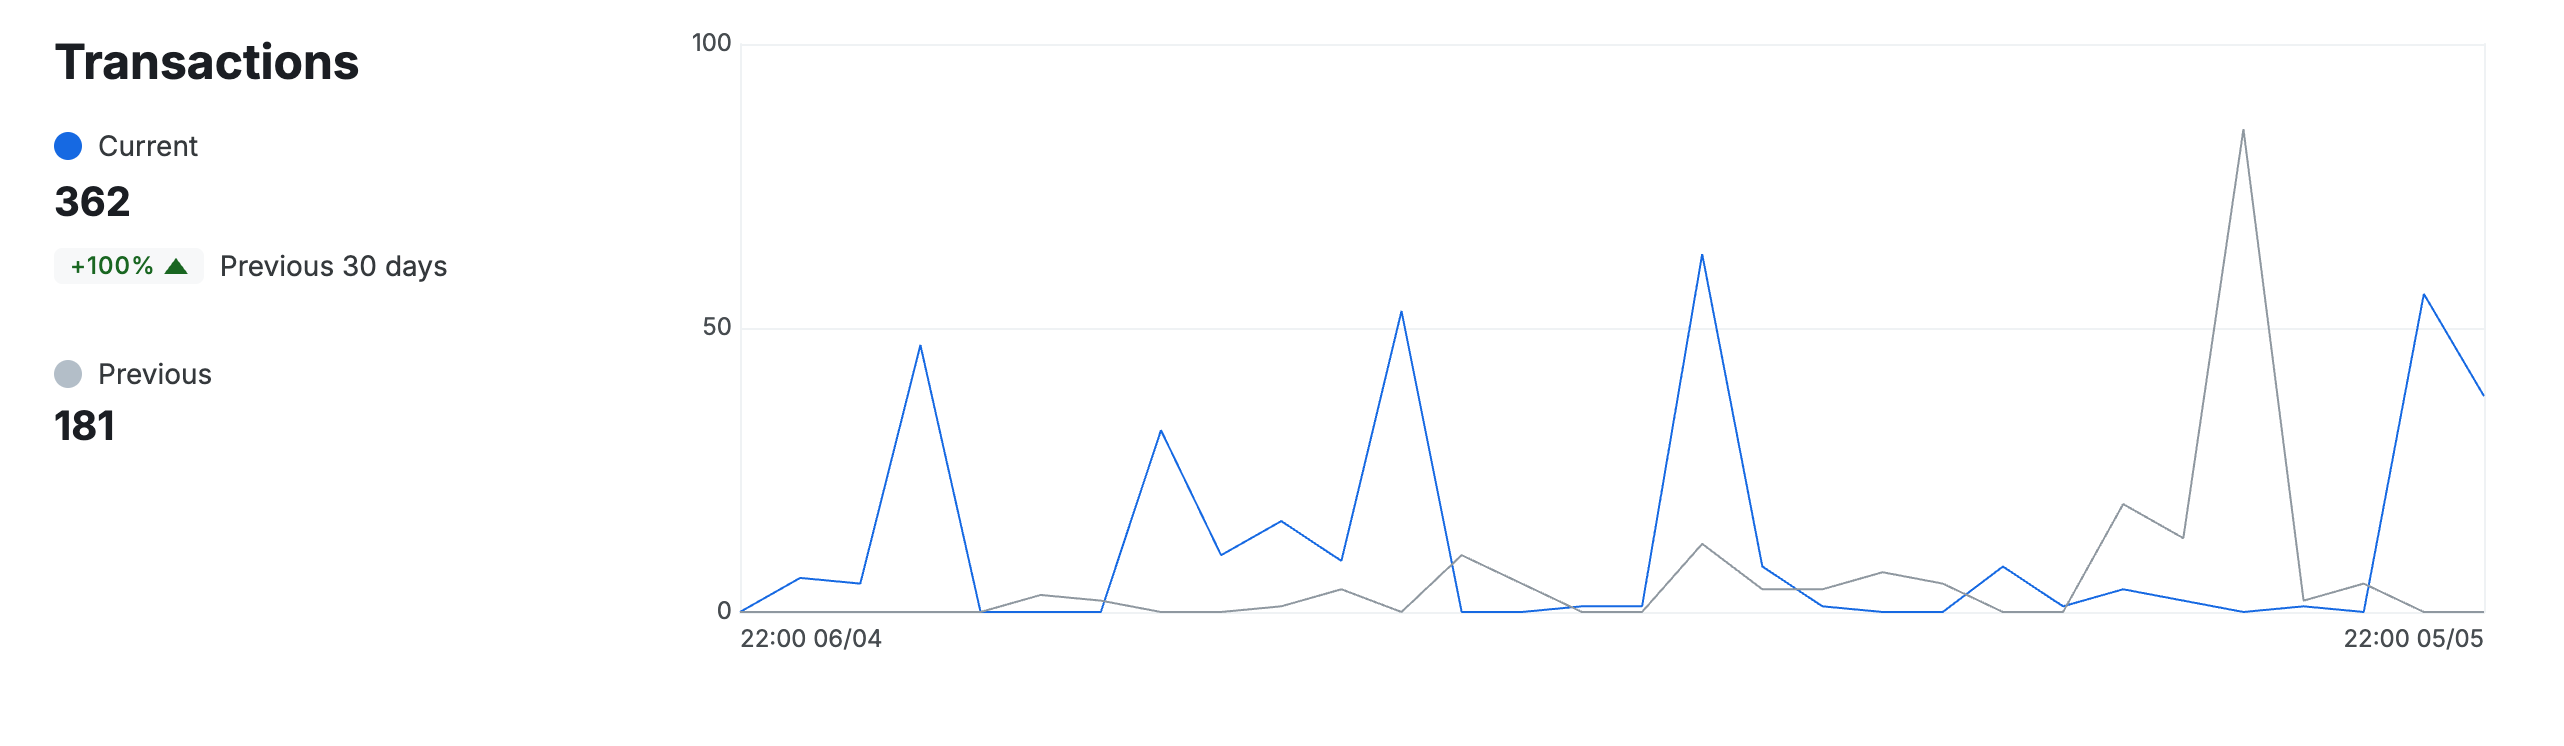
Line chart
authorized count / number of processed , where processed doesn’t include failures nor in-progress transactions.
The line-chart is both used for the homepage dashboard as well as the insights dashboard.
Deltas: Given a time frame selected of 7 days with a 5% increase in the
auth rate means that the auth rate is 5% better for the last 7 days than the 7
days before that.
Transactions funnel (Homepage dashboard only)
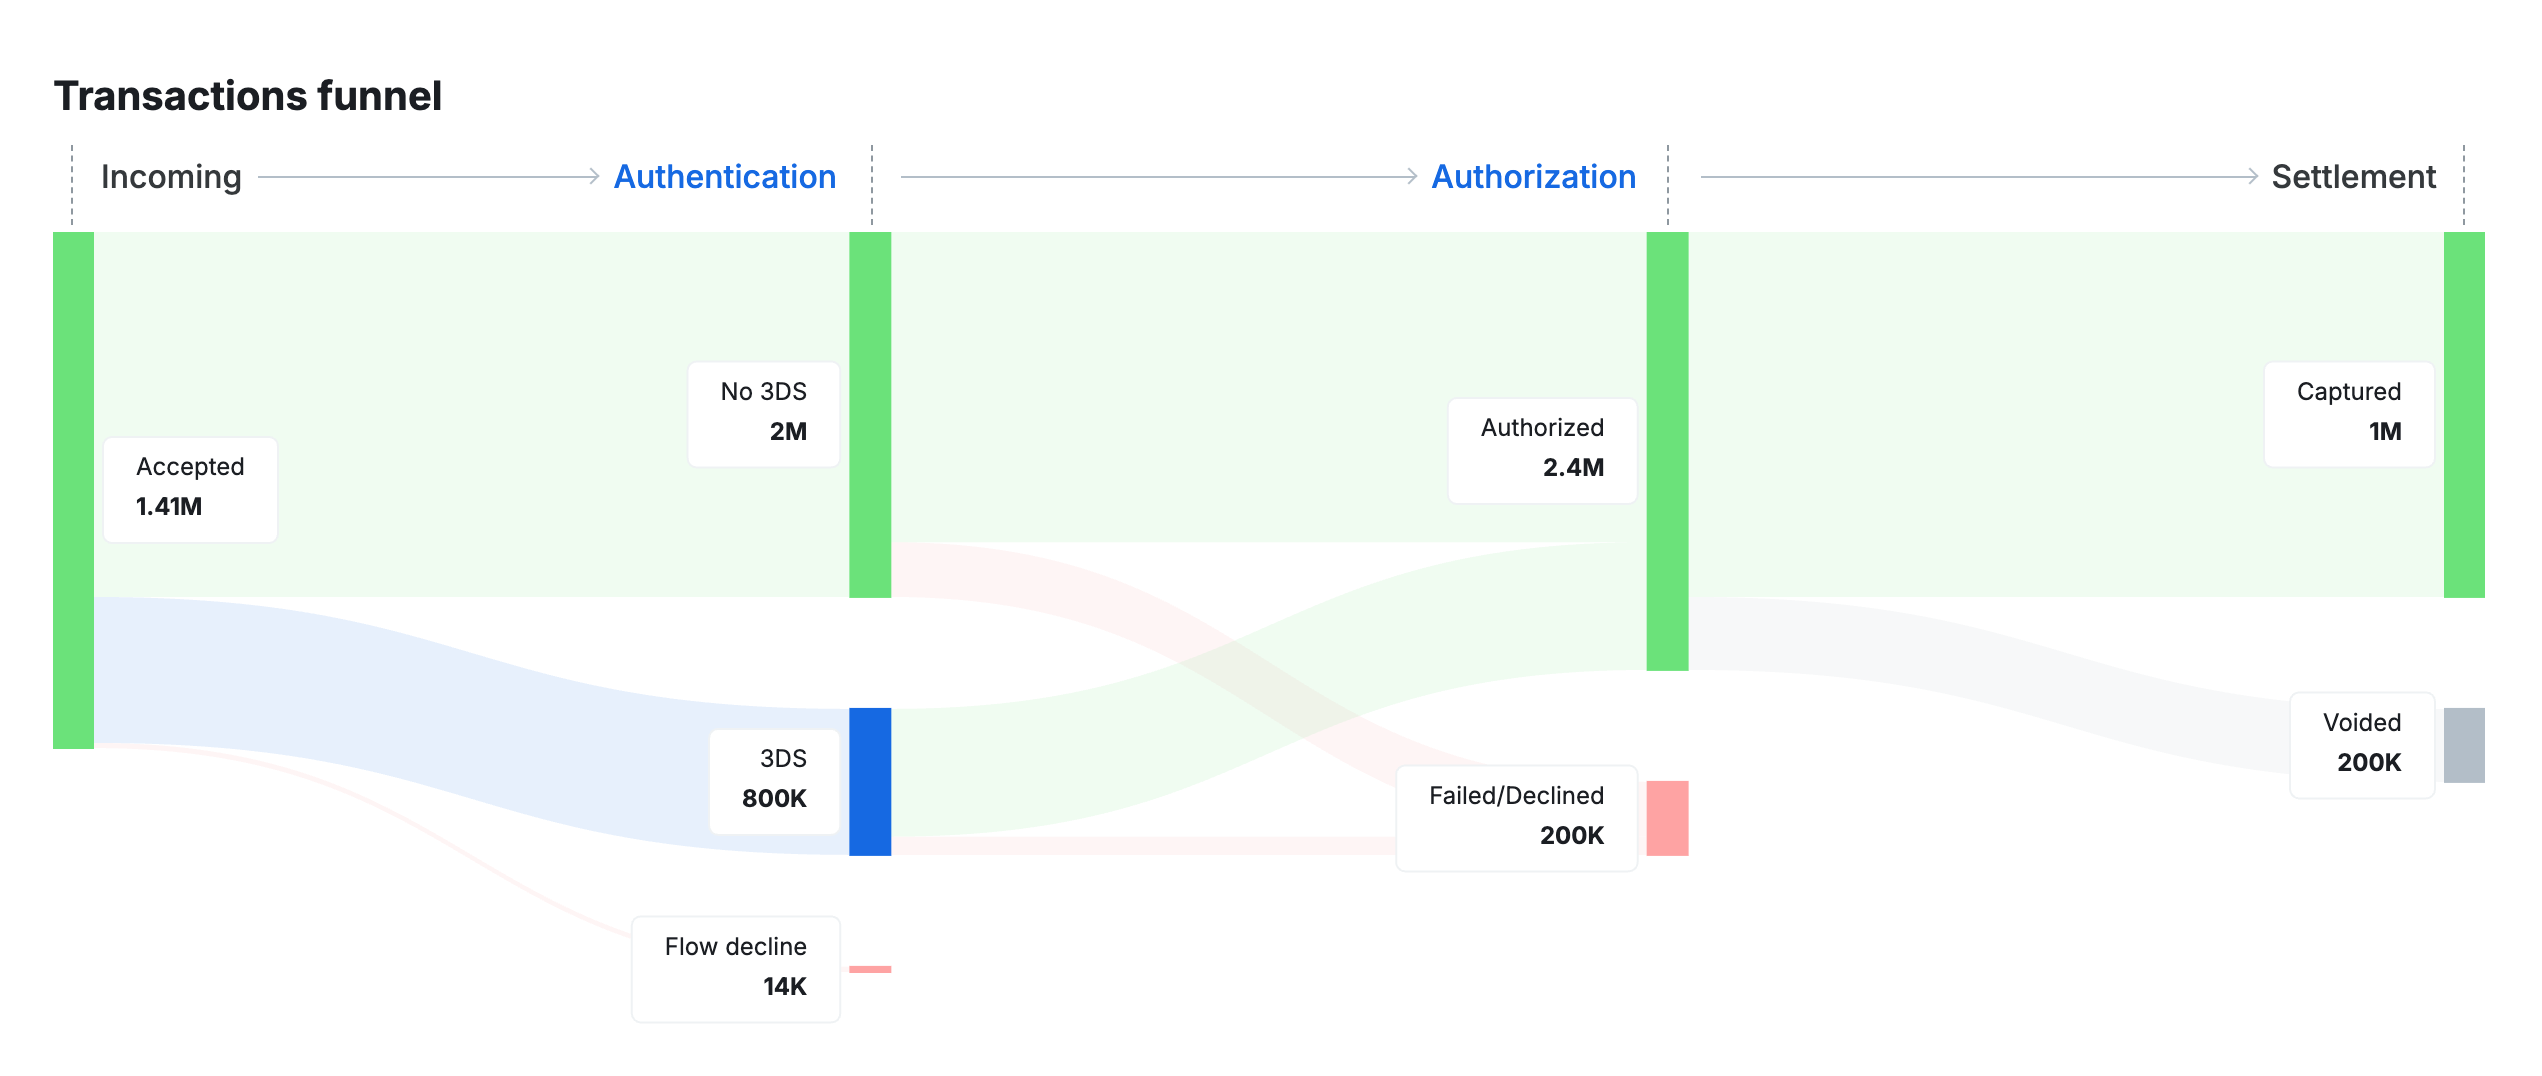
Sankey chart
Transaction stages
-
Incoming
- Accepted: Transactions that have been accepted for processing.
-
Authentication
- No 3DS: Transactions that have bypassed 3-D Secure or where 3-D Secure was not applicable.
- 3DS: Transactions (both pass-through and hosted) that have gone through a 3-D Secure flow. This does not indicate liability shift eligibility.
- Flow Declined: Transactions that have been declined by a Flow rule before entering any authentication step.
-
Authorization
- Authorized: Transactions that have been successfully authorized.
- Failed/Declined: Transactions that have failed or been declined at the authorization stage. Transactions previously authorized are not included.
-
Settlement
- Captured: Authorized transactions that have been fully or partially captured.
- Voided: Authorized transactions that have been voided. Remaining amounts from partial captures are not included.
Amounts reflect the original transaction value: When viewing the
transaction funnel by volume, the amounts shown correspond to the original
transaction value. They do not represent amounts that were authorized,
captured (for example, partial or over-captures), or voided.
Connections comparison module (Homepage dashboard only)
This module shows a list of configured connectors that have processed transactions for the timeframe as set in the top controller (24 hours, 7 days, or 30 days). Differently than the count on the top module, here the number or volume of attempts via the connector is counted, as a transaction could have multiple attempts. The auth rate in this module is calculated asauthorized count / number of processed however this is only taking into consideration the attempts via the connector minus the failed attempts.
Failures are left out and only counted towards the auth rate when an actual attempt was made to authorize at the issuer. Any technical errors or failures are therefore left out. It is also important to note that transactions that are no longer authorized, for example because they’re voided, are still counted as authorized.
This is different than the auth rate in the top module which takes the system level auth rate. As mentioned, a transaction can have multiple attempts on a connector level. It could therefore mean that the count of declines is higher in this module, than the count of declines for overall transactions.
The recovered column refers to transactions that succeeded but not via the first attempt. It could mean that a connector shows authorized transactions as well as recovered transactions. This depends on how the connector is set up in Flow configuration. If the same connector is used to perform authorizations, as well as retries, this module shows both authorized and recovered transactions or volume.
The connections module only shows connections that had activity during the configured timeframe. Configured but idle connections are left out of the view.
This connections module is only shown on the homepage dashboard. The insights dashboard has a filterable connections module allowing cross filtering of data per connector.