> ## Documentation Index
> Fetch the complete documentation index at: https://docs.gr4vy.com/llms.txt
> Use this file to discover all available pages before exploring further.
# Set Up a Monitor
> Learn how to set up a monitor to track authorization rates.
Use the **monitor setup wizard** to create a monitor in a few steps. A monitor evaluates authorization rates over time, compares results against a threshold, and triggers alerts when performance drops below the expected level.
 ## Create a monitor
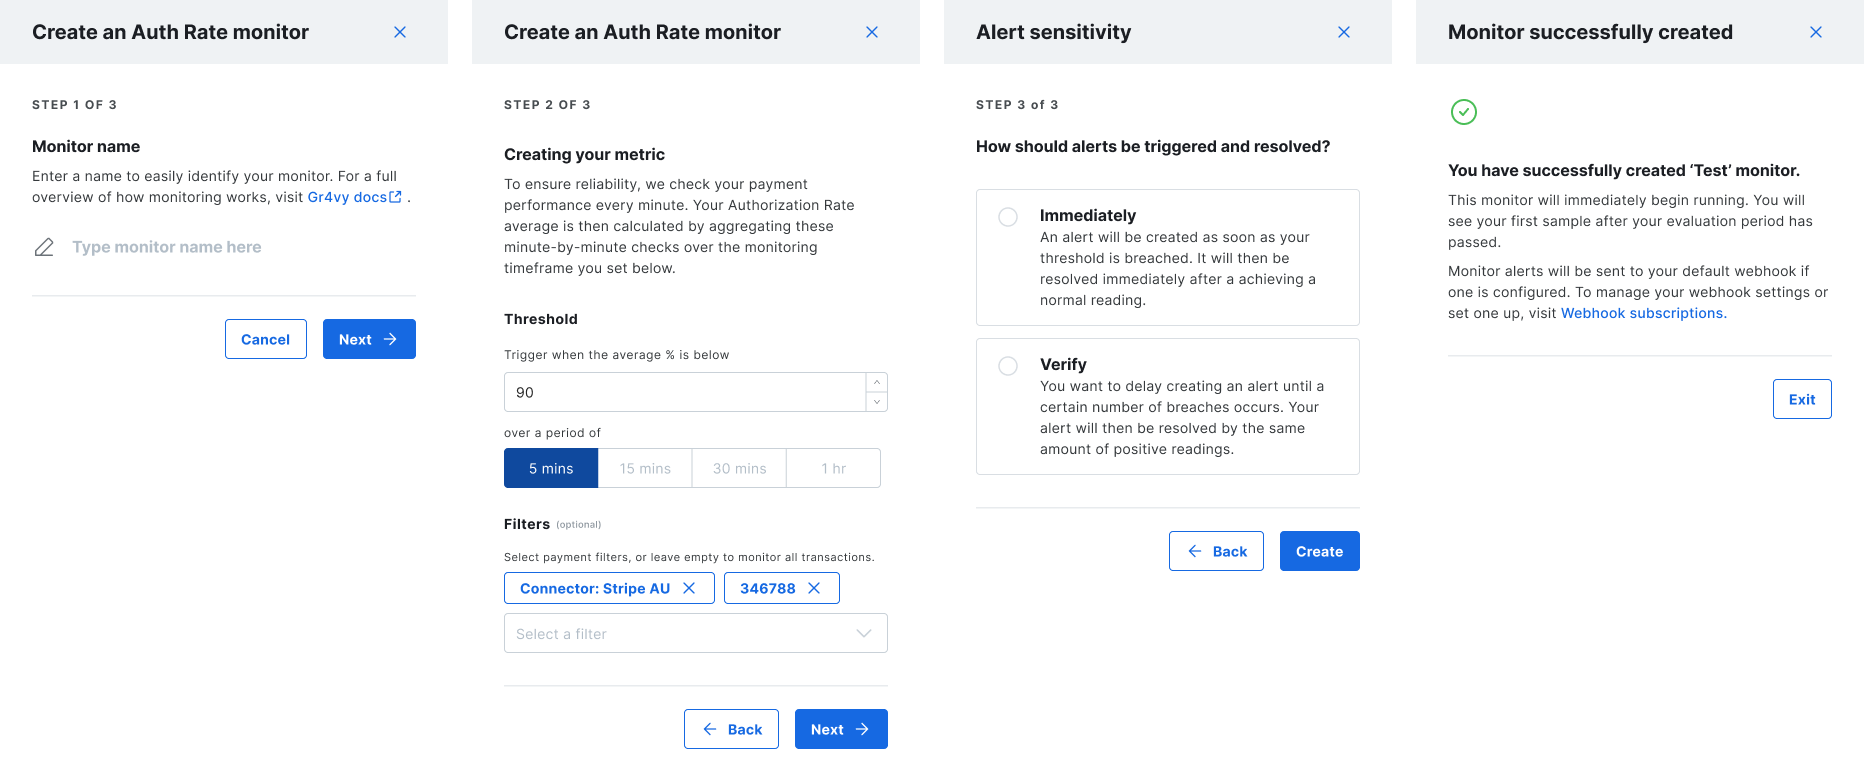
The wizard guides you through three steps: naming the monitor, defining the metric and threshold, and configuring alert behavior.
### 1. Name your monitor
Provide a clear, descriptive **monitor name** so it is easy to identify in the dashboard. Good names typically reference a specific connector, region, or traffic segment.
Select **Next** to continue.
### 2. Define the metric
Configure how the authorization rate should be evaluated.
* **Threshold** - The minimum average authorization rate considered healthy. Must be a whole number between 1 and 100. Defaults to **90%**.
* **Evaluation period** - The time window used to calculate the average: 5 minutes, 15 minutes, 30 minutes, or 1 hour. Defaults to **5 minutes**.
* **Filters** *(optional)* - Restrict which transactions are included in the calculation, such as by payment method, connector, or BIN.
Authorization rates are calculated by aggregating transaction data collected **every minute** over the selected evaluation period. See [Filters](#filters) below for the full list of available filter options.
Each monitor must have a unique combination of parameters. You cannot create a
monitor with the same threshold, evaluation period, and filters as an existing
monitor to avoid tracking the same metric twice.
Select **Next** to configure alert behavior.
### 3. Configure alert sensitivity
Choose how quickly alerts are triggered and resolved.
* **Immediately** - An alert fires as soon as a single sample breaches the threshold and resolves as soon as the metric returns to a healthy value.
* **Verify** - Choose the number of consecutive breaching samples required before an alert fires. The alert resolves only after the same number of consecutive healthy samples.
When an alert fires, it is sent to any [default webhooks](/guides/features/webhooks/overview) configured in your dashboard.
Select **Next** to create the monitor.
## Filters
Monitor metrics use a specification that controls which transactions are included in the calculation.
| Filter | Description | Example |
| ------------------------- | --------------------------------------------------------------------------------------------------------------------------------------------------------------------------------------------------------- | ---------------------------- |
| **Date / Time Range** | Filters results to data aggregated over a specific period (5–60 minutes). Uses ISO 8601 intervals, where the start or end can be a timestamp or a placeholder such as `now`, `hour_start`, or `hour_end`. | `PT60M/hour_end` |
| **Payment Method** | Filters by payment method. Transactions without a method can also be included. | `card` |
| **Payment Method BIN** | Filters using the first 6 digits of the card number (BIN). Transactions without a BIN can also be included. | `123456` |
| **Payment Method Scheme** | Filters by card scheme, such as Visa or Mastercard. Transactions without a scheme can also be included. | `visa` |
| **Payment Service ID** | Filters by the payment service used to process the transaction. Transactions without a service ID can also be included. | `06319aec-2c0f-4c7b-8af1...` |
The evaluation period and filters are **immutable after creation** to ensure the data definition remains consistent over time. The monitor name, threshold, and alert sensitivity can be updated after creation.
Updating or deleting a monitor automatically closes any open alerts for that
monitor.
## Next steps
Once the wizard completes:
* The monitor **starts running immediately**.
* The **first sample** is available straight away and covers the evaluation period leading up to the monitor's creation.
* Alerts are delivered to your [default webhook](/guides/features/webhooks/overview), if one is configured in your dashboard.
* View past alerts at any time in the **Alerts log** tab—alerts are retained for up to **365 days**.
## Create a monitor
The wizard guides you through three steps: naming the monitor, defining the metric and threshold, and configuring alert behavior.
### 1. Name your monitor
Provide a clear, descriptive **monitor name** so it is easy to identify in the dashboard. Good names typically reference a specific connector, region, or traffic segment.
Select **Next** to continue.
### 2. Define the metric
Configure how the authorization rate should be evaluated.
* **Threshold** - The minimum average authorization rate considered healthy. Must be a whole number between 1 and 100. Defaults to **90%**.
* **Evaluation period** - The time window used to calculate the average: 5 minutes, 15 minutes, 30 minutes, or 1 hour. Defaults to **5 minutes**.
* **Filters** *(optional)* - Restrict which transactions are included in the calculation, such as by payment method, connector, or BIN.
Authorization rates are calculated by aggregating transaction data collected **every minute** over the selected evaluation period. See [Filters](#filters) below for the full list of available filter options.
Each monitor must have a unique combination of parameters. You cannot create a
monitor with the same threshold, evaluation period, and filters as an existing
monitor to avoid tracking the same metric twice.
Select **Next** to configure alert behavior.
### 3. Configure alert sensitivity
Choose how quickly alerts are triggered and resolved.
* **Immediately** - An alert fires as soon as a single sample breaches the threshold and resolves as soon as the metric returns to a healthy value.
* **Verify** - Choose the number of consecutive breaching samples required before an alert fires. The alert resolves only after the same number of consecutive healthy samples.
When an alert fires, it is sent to any [default webhooks](/guides/features/webhooks/overview) configured in your dashboard.
Select **Next** to create the monitor.
## Filters
Monitor metrics use a specification that controls which transactions are included in the calculation.
| Filter | Description | Example |
| ------------------------- | --------------------------------------------------------------------------------------------------------------------------------------------------------------------------------------------------------- | ---------------------------- |
| **Date / Time Range** | Filters results to data aggregated over a specific period (5–60 minutes). Uses ISO 8601 intervals, where the start or end can be a timestamp or a placeholder such as `now`, `hour_start`, or `hour_end`. | `PT60M/hour_end` |
| **Payment Method** | Filters by payment method. Transactions without a method can also be included. | `card` |
| **Payment Method BIN** | Filters using the first 6 digits of the card number (BIN). Transactions without a BIN can also be included. | `123456` |
| **Payment Method Scheme** | Filters by card scheme, such as Visa or Mastercard. Transactions without a scheme can also be included. | `visa` |
| **Payment Service ID** | Filters by the payment service used to process the transaction. Transactions without a service ID can also be included. | `06319aec-2c0f-4c7b-8af1...` |
The evaluation period and filters are **immutable after creation** to ensure the data definition remains consistent over time. The monitor name, threshold, and alert sensitivity can be updated after creation.
Updating or deleting a monitor automatically closes any open alerts for that
monitor.
## Next steps
Once the wizard completes:
* The monitor **starts running immediately**.
* The **first sample** is available straight away and covers the evaluation period leading up to the monitor's creation.
* Alerts are delivered to your [default webhook](/guides/features/webhooks/overview), if one is configured in your dashboard.
* View past alerts at any time in the **Alerts log** tab—alerts are retained for up to **365 days**.