> ## Documentation Index
> Fetch the complete documentation index at: https://docs.gr4vy.com/llms.txt
> Use this file to discover all available pages before exploring further.
# Monitoring & Alerting
> Use monitors, thresholds, and alerts to quickly detect payment issues.
Monitoring enables you to:
* Create **monitors** that evaluate transaction data over a defined time window.
* Compare results against a configured **threshold** to detect anomalies or performance degradation.
* Automatically trigger **alerts** when a threshold is breached.
* Deliver notifications via **webhooks** to integrate with your internal tooling or incident management systems.
The term **monitors** in the dashboard consolidates several underlying
concepts—metrics, incidents, alerts, and notifications—into a single
interface. In other contexts, such as webhook events, **alerts** map to
incidents and **monitors** map to metrics.
## Monitors
A **monitor** tracks a specific metric—such as `auth_rate`—and defines how that data is measured and aggregated. For example, you might configure a monitor to track the authorization rate for a new payment processor or for a currency with historically elevated decline rates.
Currently, only **authorization rate** monitoring is supported. The setup
wizard is configured accordingly.
### Overview
The **Overview** tab lists all configured monitors.
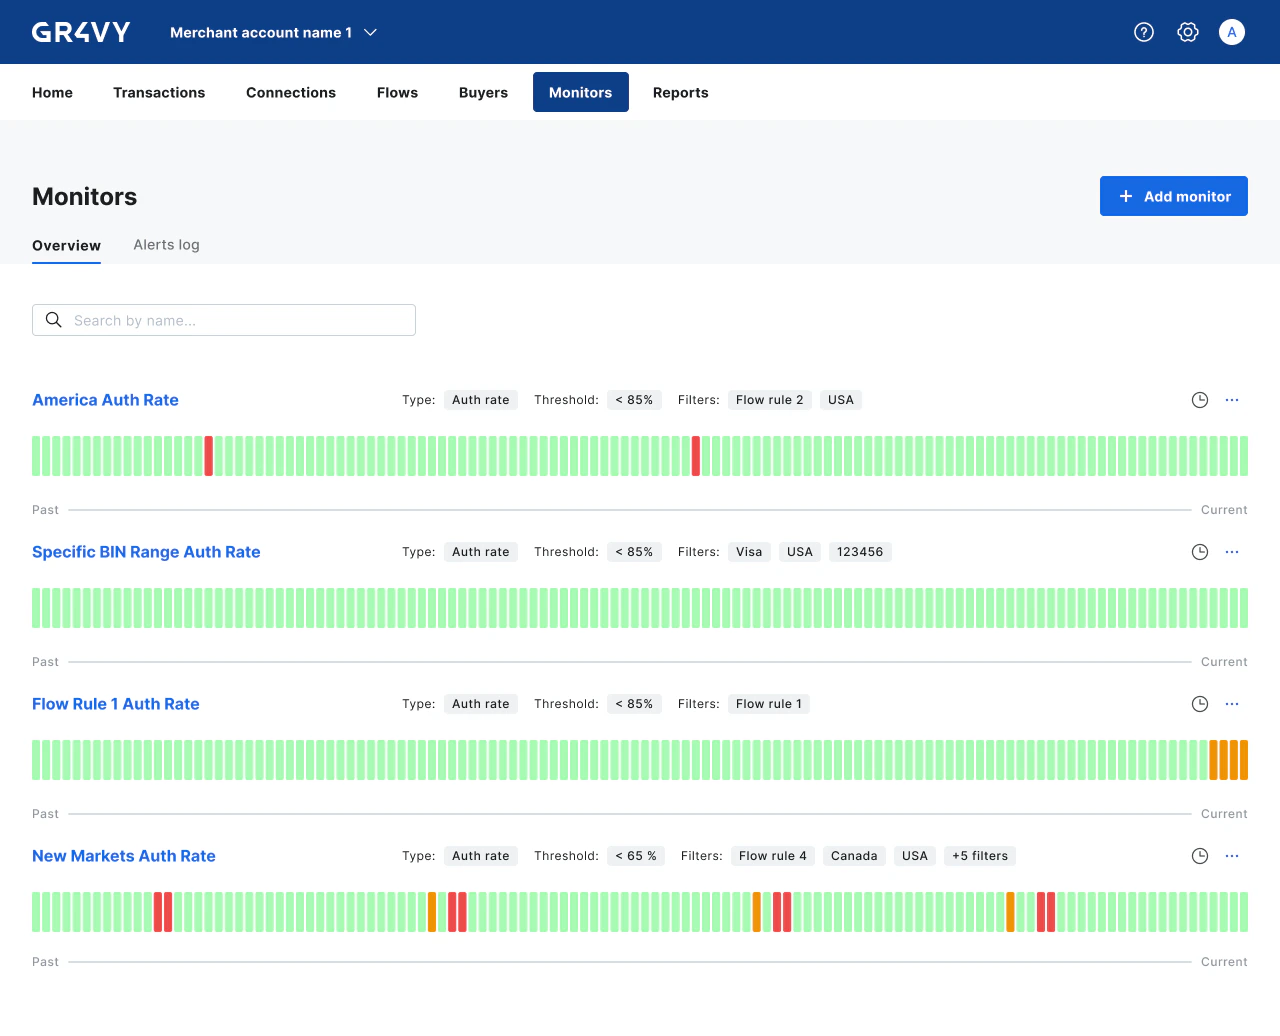 Each row includes:
* **Monitor name**
* **Metric type** - for example, Authorization rate (`auth_rate`)
* **Threshold configuration**
* **Applied filters**
* **Evaluation period** - Indicated by the stopwatch icon, showing the time window used to aggregate each sample.
* A **sample timeline** showing historical values from oldest (left) to most recent (right)
Use the **search field** to filter monitors by name.
During the launch phase, each merchant account is limited to **10 monitors**
while usage patterns are being evaluated.
## Samples
A sample represents a single data point collected during the monitor's evaluation period. Samples are displayed chronologically, with older values on the left and newer values on the right.
Samples are immutable, collected automatically every **minute**, and retained for **30 days**.
Each row includes:
* **Monitor name**
* **Metric type** - for example, Authorization rate (`auth_rate`)
* **Threshold configuration**
* **Applied filters**
* **Evaluation period** - Indicated by the stopwatch icon, showing the time window used to aggregate each sample.
* A **sample timeline** showing historical values from oldest (left) to most recent (right)
Use the **search field** to filter monitors by name.
During the launch phase, each merchant account is limited to **10 monitors**
while usage patterns are being evaluated.
## Samples
A sample represents a single data point collected during the monitor's evaluation period. Samples are displayed chronologically, with older values on the left and newer values on the right.
Samples are immutable, collected automatically every **minute**, and retained for **30 days**.
 Each sample is color-coded based on its evaluation result:
* **Green** - The sample is within the configured threshold.
* **Amber** - The sample breached the configured threshold but did not trigger an alert. When a monitor uses a **verify** sensitivity, breaches during the delay period remain amber and are not retroactively promoted when the alert fires.
* **Red** - The sample is associated with an active or historical alert.
* **Gray** - The sample has no evaluation data, for example when data for that period was delayed or unavailable.
### Tooltips
Select or hover over a sample in the timeline to view additional context for that data point.
Each sample is color-coded based on its evaluation result:
* **Green** - The sample is within the configured threshold.
* **Amber** - The sample breached the configured threshold but did not trigger an alert. When a monitor uses a **verify** sensitivity, breaches during the delay period remain amber and are not retroactively promoted when the alert fires.
* **Red** - The sample is associated with an active or historical alert.
* **Gray** - The sample has no evaluation data, for example when data for that period was delayed or unavailable.
### Tooltips
Select or hover over a sample in the timeline to view additional context for that data point.
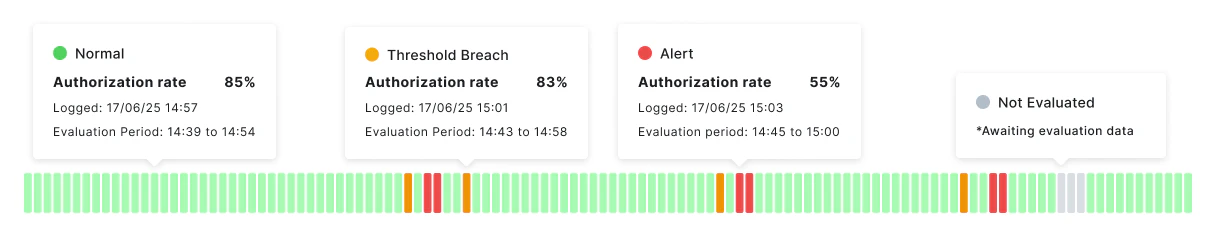 The tooltip includes:
* **Status** - The evaluation result, such as **Normal**, **Threshold Breach**, or **Alert**.
* **Measured value** - The metric value recorded for the sample, such as the authorization rate.
* **Logged** - The timestamp when the sample was collected.
* **Evaluation period** - The time window used to calculate the sample. For example, a sample may aggregate transactions from the previous **15 minutes**.
## Alerts
An alert fires when a monitor's threshold is breached and the configured sensitivity conditions are met. Alerts are sent to any [default webhooks](/guides/features/webhooks/overview) configured in your dashboard. See [Alerts](./alerts) for the full details, including how to view past alerts and how the alert lifecycle works.
The tooltip includes:
* **Status** - The evaluation result, such as **Normal**, **Threshold Breach**, or **Alert**.
* **Measured value** - The metric value recorded for the sample, such as the authorization rate.
* **Logged** - The timestamp when the sample was collected.
* **Evaluation period** - The time window used to calculate the sample. For example, a sample may aggregate transactions from the previous **15 minutes**.
## Alerts
An alert fires when a monitor's threshold is breached and the configured sensitivity conditions are met. Alerts are sent to any [default webhooks](/guides/features/webhooks/overview) configured in your dashboard. See [Alerts](./alerts) for the full details, including how to view past alerts and how the alert lifecycle works.