> ## Documentation Index
> Fetch the complete documentation index at: https://docs.gr4vy.com/llms.txt
> Use this file to discover all available pages before exploring further.
# Alerts
> View and investigate alerts fired by your monitors from the Alerts log.
When a monitor's threshold is breached, an alert is created. You can view all alerts in the **Alerts log** tab and drill into any individual alert to investigate what happened.
## Alerts log
Navigate to the **Alerts log** tab in the Monitoring & Alerting section to see all alerts across your account. Alerts are retained for up to **365 days**.
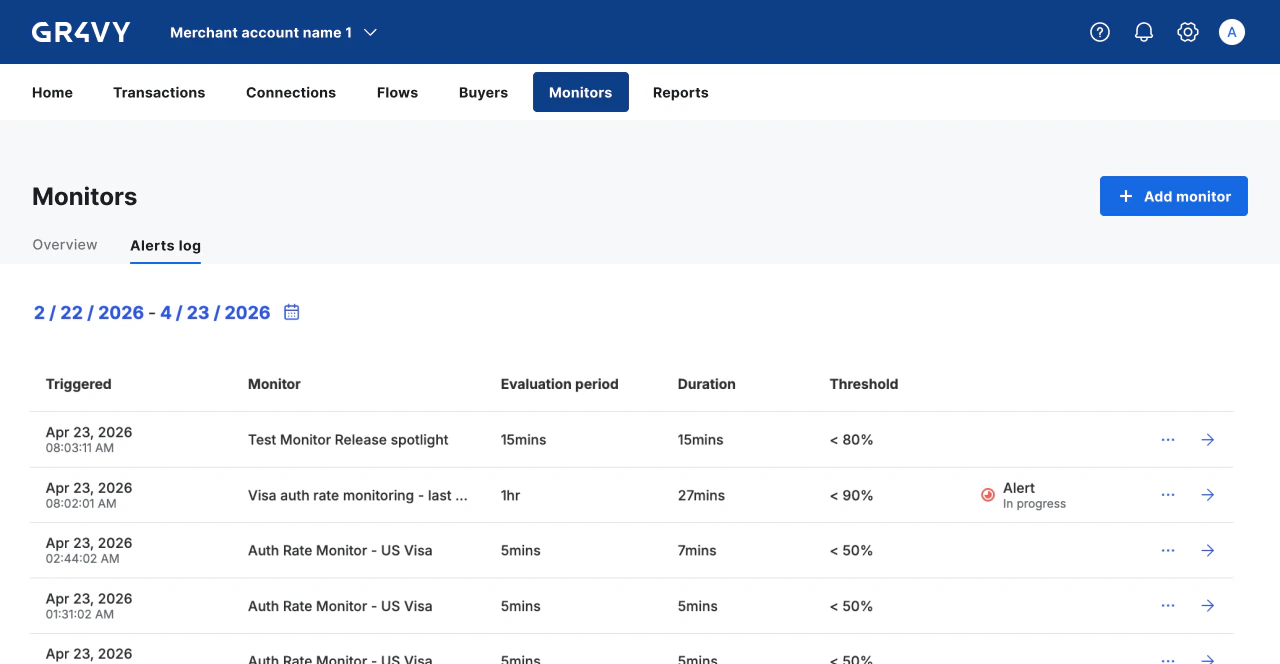 Each row includes:
* **Triggered** - When the alert was created.
* **Monitor** - The monitor that fired the alert.
* **Evaluation period** - The time window used to aggregate each sample.
* **Duration** - How long the alert lasted.
* **Threshold** - The threshold value that was breached.
Open alerts display an **in-progress** indicator. Select any row to open the alert detail page.
Use the **date range picker** to filter alerts by time period.
## Alert detail
Use this page to investigate the alert and review affected transactions.
Each row includes:
* **Triggered** - When the alert was created.
* **Monitor** - The monitor that fired the alert.
* **Evaluation period** - The time window used to aggregate each sample.
* **Duration** - How long the alert lasted.
* **Threshold** - The threshold value that was breached.
Open alerts display an **in-progress** indicator. Select any row to open the alert detail page.
Use the **date range picker** to filter alerts by time period.
## Alert detail
Use this page to investigate the alert and review affected transactions.
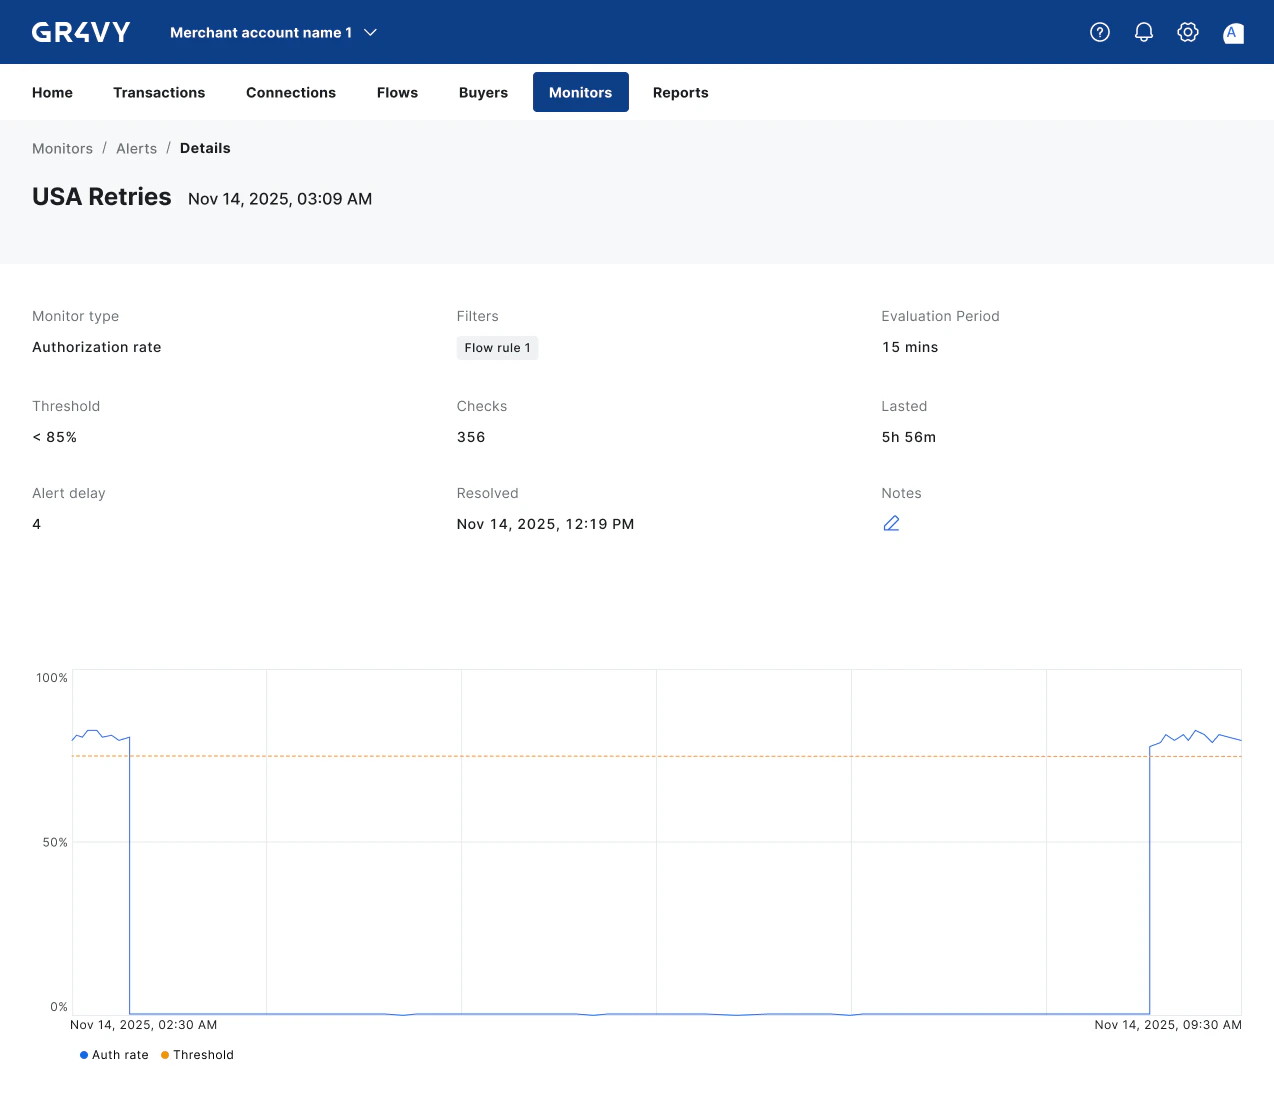 The summary at the top of the page includes:
* **Monitor type** - The type of metric being monitored, for example authorization rate.
* **Filters** - The criteria used to restrict which transactions are included in the metric calculation.
* **Evaluation period** - The time window over which transaction data is aggregated for each sample.
* **Threshold** - The condition that, when met, triggers an alert.
* **Checks** - The total number of samples recorded since the alert opened.
* **Lasted** - How long the alert remained open.
* **Alert delay** - The number of consecutive breaching samples required to trigger the alert. Pre-delay breaches are visible in the overview timeline but are not included in the alert detail. The same number of consecutive healthy samples is required to resolve it.
* **Resolved** - The timestamp when the alert was closed, if applicable.
* **Notes** - Any notes added by users to provide additional context about the alert.
### Authorization rate chart
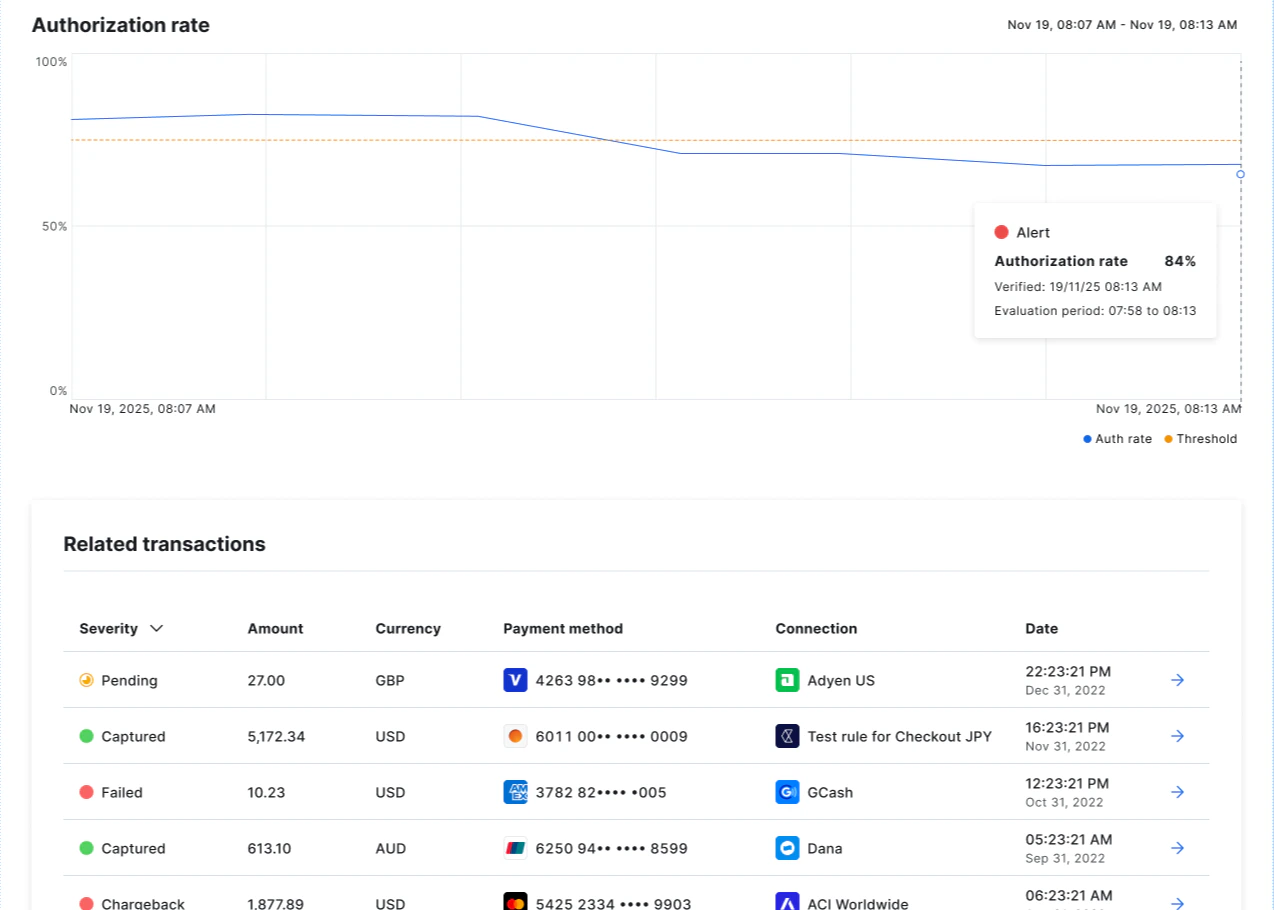
Below the summary, a line chart tracks the authorization rate over the alert window.
* A **solid line** shows the measured authorization rate over time.
* A **dashed amber line** marks the configured threshold.
* Data points are color-coded: **blue** for normal, **amber** for threshold breach, and **red** for alert.
The chart refreshes automatically every **60 seconds** while the alert remains open.
### Related transactions
Transactions recorded during the alert window are listed below the chart. Use this panel to identify patterns or isolate affected payment flows.
The summary at the top of the page includes:
* **Monitor type** - The type of metric being monitored, for example authorization rate.
* **Filters** - The criteria used to restrict which transactions are included in the metric calculation.
* **Evaluation period** - The time window over which transaction data is aggregated for each sample.
* **Threshold** - The condition that, when met, triggers an alert.
* **Checks** - The total number of samples recorded since the alert opened.
* **Lasted** - How long the alert remained open.
* **Alert delay** - The number of consecutive breaching samples required to trigger the alert. Pre-delay breaches are visible in the overview timeline but are not included in the alert detail. The same number of consecutive healthy samples is required to resolve it.
* **Resolved** - The timestamp when the alert was closed, if applicable.
* **Notes** - Any notes added by users to provide additional context about the alert.
### Authorization rate chart
Below the summary, a line chart tracks the authorization rate over the alert window.
* A **solid line** shows the measured authorization rate over time.
* A **dashed amber line** marks the configured threshold.
* Data points are color-coded: **blue** for normal, **amber** for threshold breach, and **red** for alert.
The chart refreshes automatically every **60 seconds** while the alert remains open.
### Related transactions
Transactions recorded during the alert window are listed below the chart. Use this panel to identify patterns or isolate affected payment flows.
 ## Alert lifecycle
An alert moves through two states:
* **Alert** - The monitor's threshold is currently breached and the conditions required to resolve it have not yet been met.
* **Resolved** - The alert has closed. The detail page displays a **Resolved** timestamp showing when the alert was closed.
## Alert notes
Users with the appropriate permissions can add or edit a note on any alert. Notes are useful for recording root causes, actions taken, or any other context relevant to the alert.
To add or update a note, open the alert detail page and edit the **Notes** field. Changes are saved immediately and recorded in the [audit logs](/reference/audit-logs).
## Auto-close behavior
Open alerts are automatically closed in three situations:
* **Metric recovered** - The required number of consecutive healthy samples has been observed, as determined by the monitor's configured alert sensitivity.
* **Monitor updated** - Any open alert for the monitor is closed as soon as you save a change.
* **Monitor deleted** - Any open alert for the monitor is closed immediately when the monitor is deleted.
## Alert lifecycle
An alert moves through two states:
* **Alert** - The monitor's threshold is currently breached and the conditions required to resolve it have not yet been met.
* **Resolved** - The alert has closed. The detail page displays a **Resolved** timestamp showing when the alert was closed.
## Alert notes
Users with the appropriate permissions can add or edit a note on any alert. Notes are useful for recording root causes, actions taken, or any other context relevant to the alert.
To add or update a note, open the alert detail page and edit the **Notes** field. Changes are saved immediately and recorded in the [audit logs](/reference/audit-logs).
## Auto-close behavior
Open alerts are automatically closed in three situations:
* **Metric recovered** - The required number of consecutive healthy samples has been observed, as determined by the monitor's configured alert sensitivity.
* **Monitor updated** - Any open alert for the monitor is closed as soon as you save a change.
* **Monitor deleted** - Any open alert for the monitor is closed immediately when the monitor is deleted.